White Papers / Posts
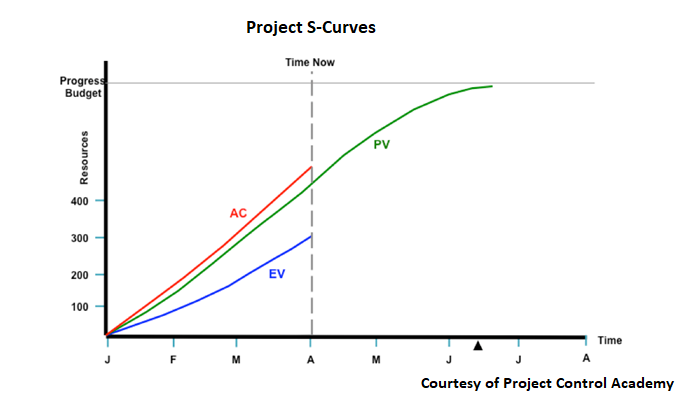
How Do YOur Project S-Curves Line-up?
Multiple choice question. So your boss walks-up to you and asks how your project S-Curves are lining-up. What is your answer?
- (a) Just perfectly.
- (b) Actuals exceeding Planned and Earned and we are investigating.
- (c) Oh Crap! (On the inside.)
- (d) What are S-Curves?
It’s a good chance your boss has read this article. So if you answered (c) or (d), you need to get up-to-speed real quick so read on. S-Curves serve important roles in forecasting capital financing requirements, earned versus pay-out assessments and general project condition. This article will discuss the players for an effective forecasting model. (Graph courtesy of Project Control Academy) If you are like most of us, your S-Curves do not line-up.

ArcGIS Pro or Google Maps
Ok, Ok, this might not be an apple to apple comparison, but hear me out. I have been a user of ArcMap® (predecessor to ArcGIS®) before I ran into Google® Maps. Now since ArcGIS was released in 2015, I decided to see what improvements have been made and do a platform check on the two. So here it goes….
ArcGIS
First of all, ArcGIS® is a Windows App. That means you have to install software on all computers that want to run the software. They offer a free viewer App similar to Acrobat Reader, Plant3D, CAD, et al. Otherwise, you are paying a yearly use subscription….which can add-up. Also there is a distribution license cost as well. What does this mean? When you create your ArcGIS project you have to deploy it to the cloud for other people to use it. This may require a distribution license. What if you miss a subscription? Do you risk losing your right to maintain your projects? Good question. I could not pull that from the available documentation. There is also a Cloud version of the software much like Office 365 and a JavaScript API (for you non-geeks, Application Programming Interface) for web page support. I did not try out the Cloud version but I did mess around with their API since I am more familiar with that platform. ArcGIS® can generate both 2D and 3D representation of your data. Key words here are “representation” and “your data”.
Who Is Your Leak Detection Device?
Once upon a time I lived in a neighborhood that had serious issues with their underground water, sewer and gas piping. It looked like the city water department had a permanent crew digging up water and sewer mains that have leaked, broke or otherwise failed. I recall one morning I was awoken by waterfall sounding noises and flashing red beacons. As I went to investigate, I was greeted by Officer Joe who informed me that the city water main broke on my property. Oh Great. He called the city but no one was there at 3 AM in the morning. So we sat and talked and watched as much of my front lawn floated down the street. It guess it was my turn. As it was the weekend, I brought out some chairs and watched the repair crew replace the section of pipe. I was surprised to see a 3 inch hole and no other obvious signs or damage. Hmmm.
Taking walks also was an adventure as you could smell the Mercaptan from all the gas line leaks. Over time, these gas leaks would tend to kill your grass, so you would report it as soon as possible. Kids (I think) thought it was a funny night time prank to light-up the leaks for special effects. Imagine looking down the street and seeing ten or more ground flares. Well, that got the attention of the gas company.
ROE / PIA For Leaky Relief Valves
Overpressure relief devices can be sneaky release points. Refineries routinely pull and inspect relief valves during turnarounds. But some do this even after one activation. Why? Well, because some relief valves do not re-seat correctly and will tend to leak.
For pipelines, releases from leaky relief valves (or pipelines) may go undetected for some time. Unless you have subscribed to Satelytics® monitoring or have stationary gas detectors installed, your neighbors become your alert system. Be prepared to defend your ROE/PIA analysis to investigators.
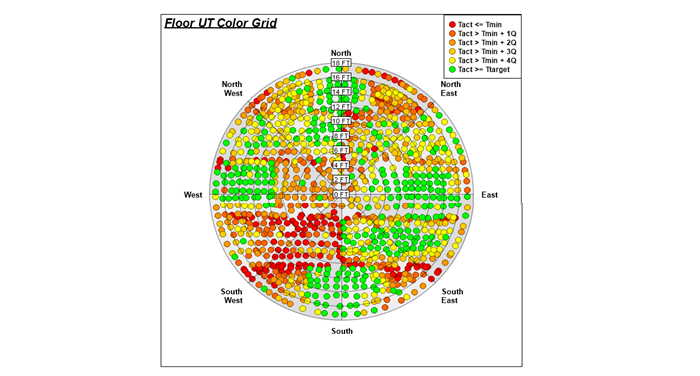
Porting API 620 / 653 MI Data to a Better UI
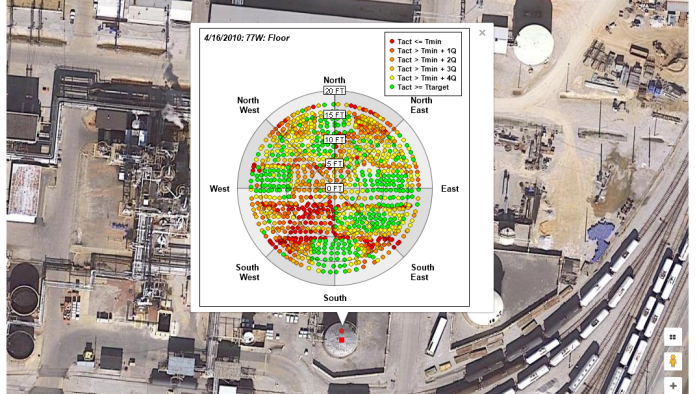
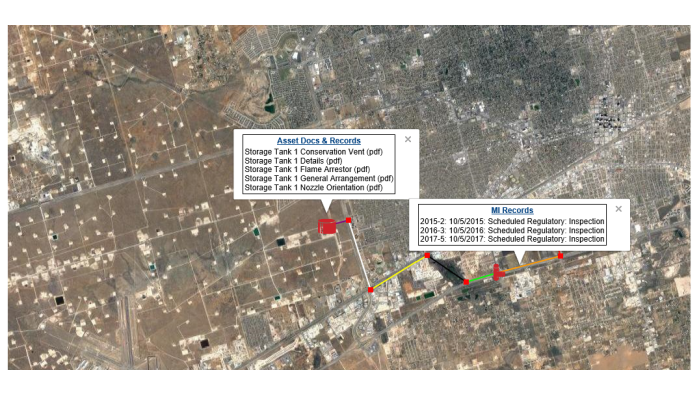
Inspection data for API 620/650 tanks can be voluminous. Many times this data is entered into an Excel spreadsheet which is then assembled into a report and goes to archive. Data visualization is poor and trends are harder to predict. There is a better way, port it to HCI’s Google Map interface.
The screen shot herein displays MI data for an API tank floor color coded by material loss. Tank on-click events can show data plots as shown here, the actual MI records or tank reference documents and records. Drills down to tank components as well.
If you went through the effort to get the MI data, why not take it a little further and display it with a better user interface?
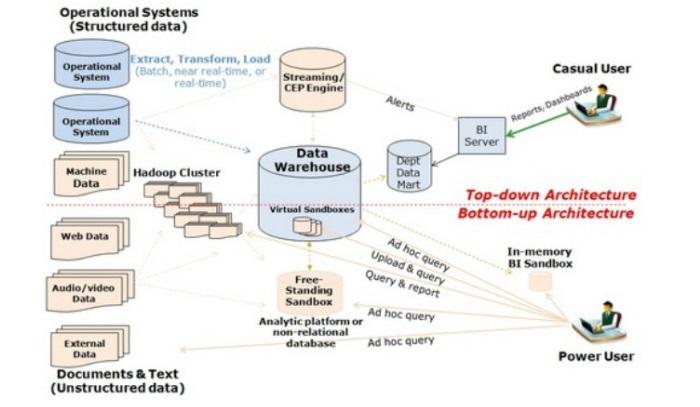
Big Data and Oil & Gas
If you are looking at this diagram (Courtesy of Rose Technologies) and understand it well, face it, you are a genius.
Most of us need a little help here. So here it goes....
Big Data is a term used when the data is either voluminous, high velocity (bandwidth) or has data diversity like documents, videos, data, etc. Think of a digital control system (DCS) where the system samples the data stream and, based on the point-values, makes process control decisions. That is one element of Big Data, it is real time sampling of data streams. After sampling, the data could be trashed. However, if someone asks what just happened, well now we are talking storage. For large systems, potentially Yottabytes of storage. (Ok. Take a minute to look that one up.)
Once Upon A Time B31G Was Easy To Use...
Remember the good ole days when you encountered pipe corrosion you would take a length and depth measurement and go to the B31G tables to see if you were in trouble or not? Me neither (lol).
I found in my technical library a 1991 copy of B31G and was amazed as to how we analyzed corrosion back then. We had tables and one set of equations (that gave better results). That edition also had code for a Basic program if you were so inclined. That was it.
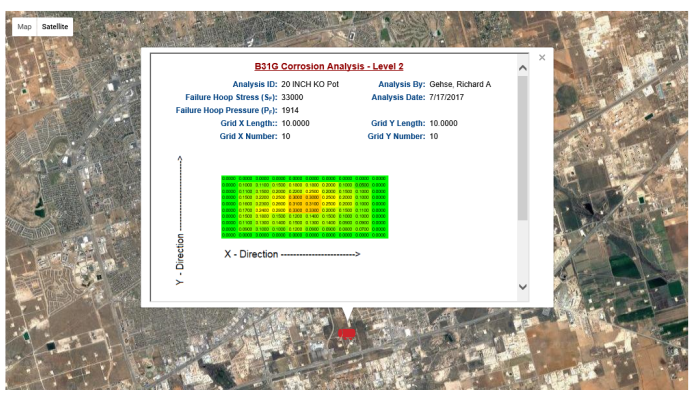
Today, B31G has evolved (or has morphed) into a highly analytical code supplement for the B31.X series. And, along the way, has lost its ease of use. Well, HCI Software has coded-up B31G as part of our B31.X series set of Apps. Shown below is a screen shot of the Level 2 Analysis color coded for corrosion depths and calculated Failure Stress and Pressure values. One still needs to include allowable stress factors for the B31.X code you are using. This is included in the setup tab. If you prefer a Level 0 or 1 analysis, they are included too.
A Better UI For Finding Documents and Records
The days of wrestling through Asset Trees and cryptic CMS search engines is over. I remember searching for drawings back a few years ago that was absolutely frustrating. We actually had to budget hours and funds for our own document management person just to filter through the search results. BTW, thanks Bob. For one, using the same search engine for project documents as with archive documents is just not what you want to do. Anyway...........
ASME B31.8S Potential Impact Area (PIA) Tool
This article will discuss HCI Systems risk assessment tool as discussed in ASME B31.8S, Section 3 Consequences. This is the second article in this series. If you have not read the previous articles, please visit my LinkedIn page.
ASME B31.8S is all about managing system integrity of gas pipelines. It is about 70 pages of means and methods. OK. It is not an easy read. It does pull-in a set of compliance requirements that most other regulations like PSM, RMP, et. al. have already in place. What is interesting in this supplement is its focus on consequences. Most risk based assessments have a risk and consequence component. (HCI also has a cost component too). But if you have ever participated is a risk assessment session, at times, there seems to be a tendency to lessen the risk factor or the risk factor cannot be accurately assessed.
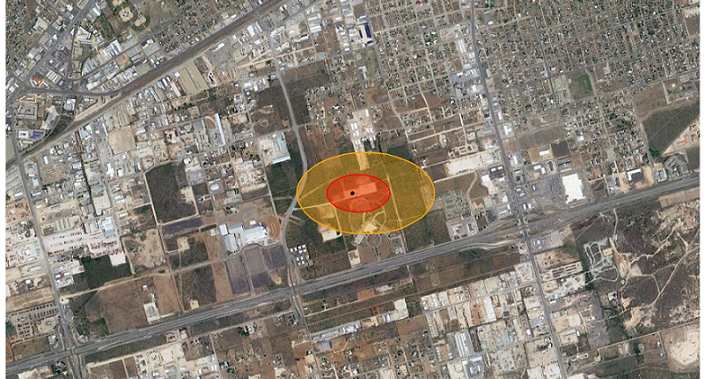
ASME B31.8 H2S Radius of Exposure (ROE) Tool
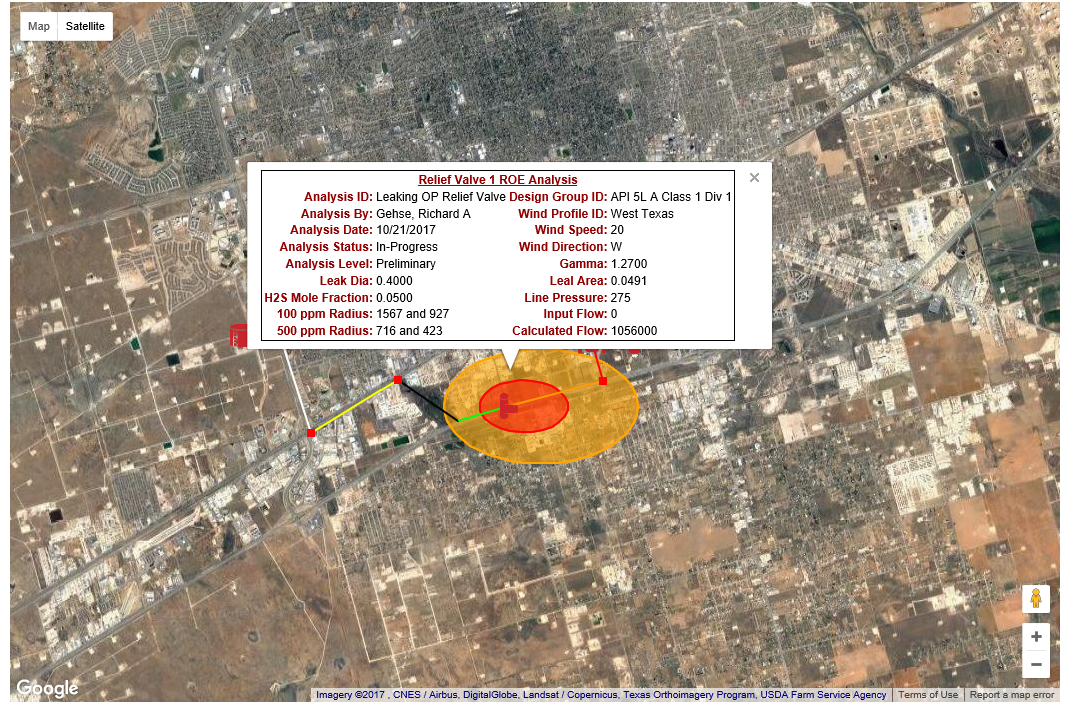
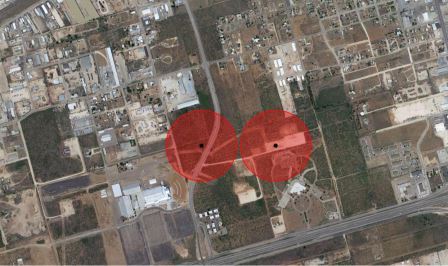
I am starting this series with an example of how the Radius of Exposure (ROE) tool works. B31.8 Chapter IX discusses Sour Gas Service. Sour gas, if you do not know, is Hydrogen Sulfide or H2S.
H2S is nasty stuff. Anyone who has worked at a refinery knows they are required to wear a H2S monitor for safety. These devices are usually set for a low PPM like around 10-20 PPM for obvious reasons. H2S has the side effect of destroying your sense of smell at level around 50 PPM. So without a monitor you could walk into a H2S cloud with little advance warning. By the way, H2S smells like rotten eggs. At elevated levels H2S, it starts messing with your respiratory system. So that is your next level of awareness. At levels 500 PPM you enter the IDLH zone. IDLH stands for Immediate Danger to Life and Health.
Transporting sour natural gas brings with it a host of material selection issues, NACE requirements, PWHT of welds, etc. And, the need to risk assess leaks, certainly when in proximity to populated areas. This is addressed in B31.8 Chapter IX, Section 850.
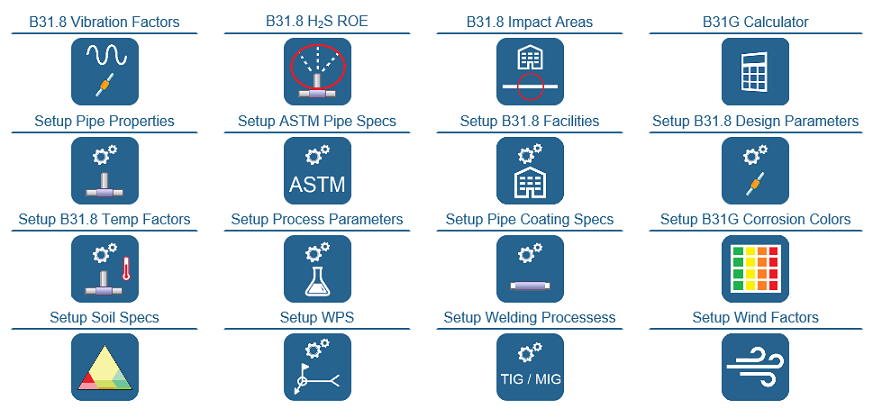
Not Just Pretty Icons...Cool B31.8, B31.8S and B31G Tools Too!
This article is a follow-up on my previous article on tablet ready MI Tools from HCI Systems software and many requests on how these tools can help with the PHMSA pipeline industry.
So here we go....
If you are familiar with the ASME B31.8 code, B31.8S Supplement and B31G Manual For determining Remaining Strength of Corroded Pipelines, you are looking at sixteen (16) compliance Apps from vibration factors to dispersion modeling and wind influence factors.
The B31G calculator provides Level 0, 1 and 2 analysis of corroded pipelines. Level 1 and 2 align with API 579 fit-for-service analysis levels.
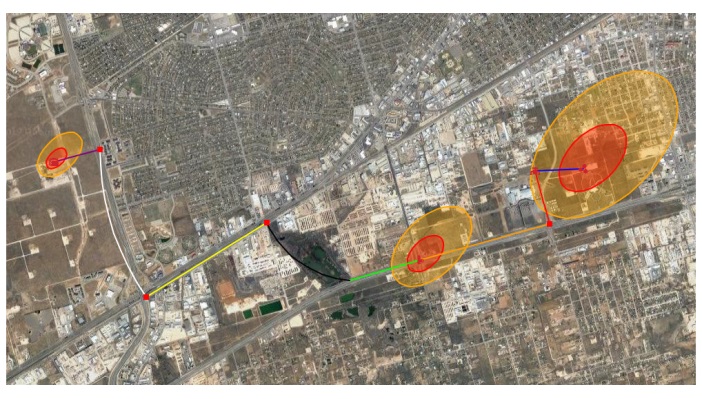
The B31.8 ROE provides a risk assessment tool for H2S releases. This is derived from the Pasquel-Gifford equation and then some. Wind impact can be modeled to allow the radius of exposure (ROE) to be sculpted for wind direction and speed.
The B31.8 Impact Areas provides a risk assessment tool for line leaks or breaks. As with the ROE tools it has a wind influence factors for wind direction and speed.
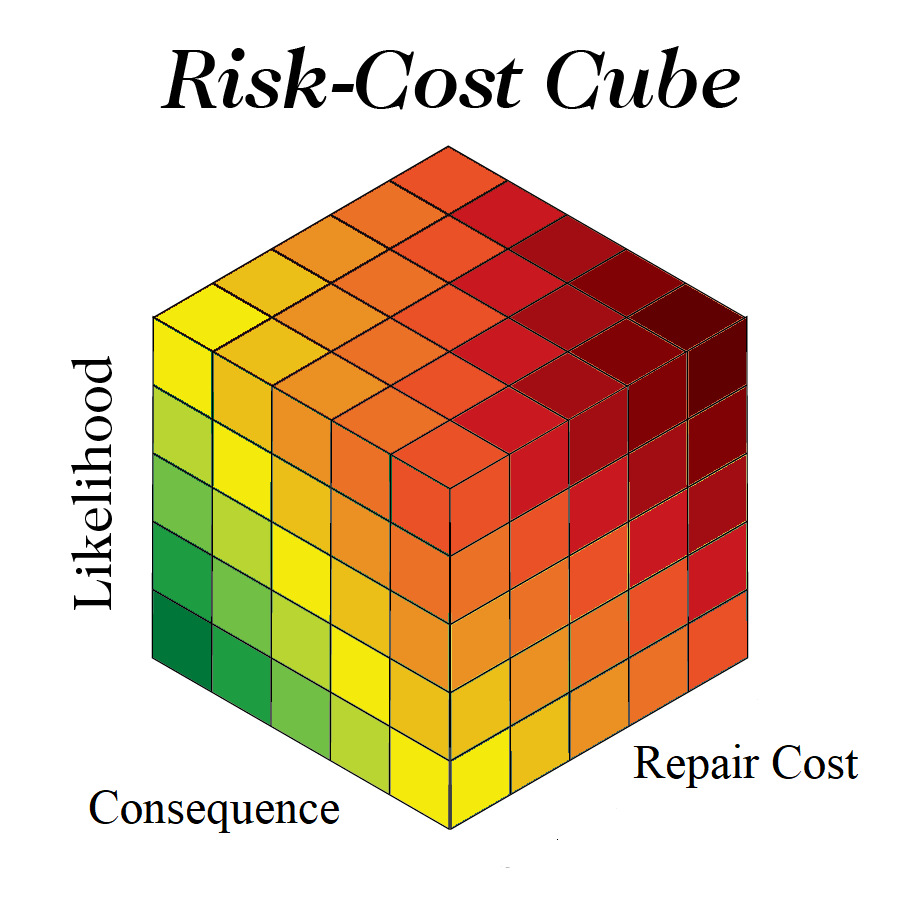
Risk-Cost Cube
This article will discuss the RBI methodology of probability x consequence = risk rank equation and ties it in with another variable, cost to repair (or replace). This is not to be confused with some consequence models that embeds the overall cost of the event since that usually involves other cost factors as well, such as loss of production. The cost factor gives the risk ranking a third dimension or cube that relates similar risk ranked issues with the cost to repair (or replace).
But, before I get started, I would like to thank Kelly Rice at Imagination Print and Design for her help in visualizing the risk-cost cube. Her web site: http://imaginationpad.com/
So now the backdrop story.....
API Tank MI Time Saving Tool
API tank floors typically have overlap plate welds making a UT crawler difficult to use. The inspector then resorts to taking UT readings individually which may consist of hundreds if not thousands of data points. Using an X-Y coordinate system for the UT data points is problematic because the geometric shape lends itself to an Angular-Radii coordinate system. Either way it is a data gathering nightmare.
So what do you do? Well, you need to get your hands on a Olympus 38DL. Using this device you can pre-program your Angular-Radii data points in advance and then take your UT readings in sweeping arcs. OK, so now you have your data points. So where are the time savings?....
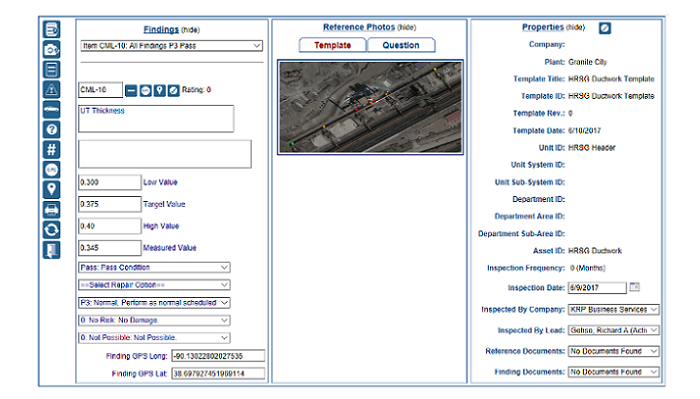
MI Tablet Application
This is a screen shot of HCI Systems, Inc. MI Manager application showing a tablet capable data entry form. Now recognizing that there are many applications out there for mechanical integrity, why should you try this one out?
First of all, for a limited time, this beta version is free. So don't hesitate to contact me at the email address below for the details.
So why is this one different? Here are the bullet points:
- It uses GPS positioning to locate and set the inspection location.
- It is a generic MI application. It can be used to inspect just about anything. Ideal for pipelines and remote assets.
- MI Manager has all the necessary calculations, retire date projections, trends, reports, document management, repair status, etc.
- You can pre-set the inspection CMLs, TMLs and/or questions in advance with its forms editor. This includes reference photos and documents such as procedures and P&IDs, etc. These expand to full screen on cursor click.
- You can add on-the-fly additional CML points and questions from the menu located on the left side of the screen.
- more.......
Safety Integrity and Incident Tracker
Over the years I have come across many Mechanical Integrity (MI) software applications. Some were very complicated and some were too simplistic. Most had a specific type of asset they were specialized in such as boilers, vessels, piping, instruments, etc. but fell short of an overall easy to use MI solution.
The screen shot shown here is of a generalized MI application that was used to track safety risks and pre-incident issues. It uses a Google Maps interface to show the region and color coded icons to represent safety risk, pre-incident issue, asset condition, etc. If you have an aerial photograph, it can use that as the background as well.
In a glance an assessment of the situation can be seen. Clicking on the asset icon, pops-up an information window that can be coded to show the findings, material loss curves, projected retire dates, inspection documents, etc. Different icons can be used to distinguish between different asset types.
The application is tablet compatible which allows the "inspector" to document the finding where it is and using GPS functionality, its GPS coordinates. It has a user configurable checklist editor to create and edit the checklist questions. It also has a datalogger interface for data intensive information.....
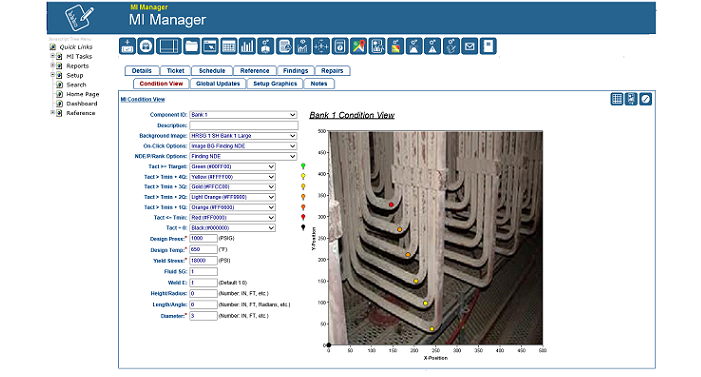
HRSG Boiler Furnace Tube End-of-Life Tool
Projecting end-of-life (i.e., tube rupture) of HRSG, boiler or furnace tubes is a little tricky. On one hand you have the data gathering and input process. On the other hand is the technical assessment of what the Tmin really is. The principal failure mode we are addressing is tube wall loss by particulate erosion.
The data gathering component is similar to that discussed in one of my earlier articles, "API Tank MI Time Saving Tools". First, you need to get your hands on a Olympus 38DL datalogger. Using this device you can pre-program your data points in advance and then take your UT readings as indicated by your MI diagram. The background of the MI diagram can be a sketch or photo. When you dock your the 38DL to your PC using the supplied GageView software application, you can view your data for a reality check.
For the analysis, you need to install another component tool called MI Manager, offered by HCI Systems, Inc., MI Manager can import the 38DL data directly into the MI Manager database. The data can then been presented visually as shown above. Data point colors are user configurable. Material loss trends can be plotted and end-of-life projections can be assessed.
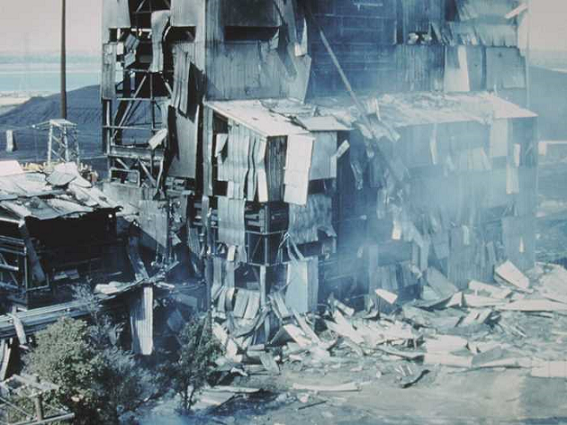
Damage Limiting Construction - Part 1 The Event
This photo does not depict a recent event. So no need to try to "Google" it. It was one of my experiences early on in my career. Some called it the Humpty Dumpty project. I have used this photo in many of my Damage Limiting Construction (DLC) seminars. It's an eye opener. It is not an example of how to design a structure for overpressure. Although, in this example, the combustible was coal dust, it is equally applicable for any dust that is combustible. This is the first article in a multi-part series that will discuss methods to reduce the risk of such an event including the technique of damage limiting construction.
At first glance the photo appears to suggest the event was limited to the building involved. But, as future articles will show, the event propagated throughout the plant. So what happened here? Well, apart from the presence of combustible dust above the LEL and an ignition source, the structure was not designed to fail in a predetermined way. The confinement of the fire ball by the siding resulted in an increasing internal pressure that eventually overcame the siding fasteners. Just about all of them. The fire ball under that initial pressure made its way to other parts of the plant shaking structures as it propagated releasing additional dust to fuel the event.....
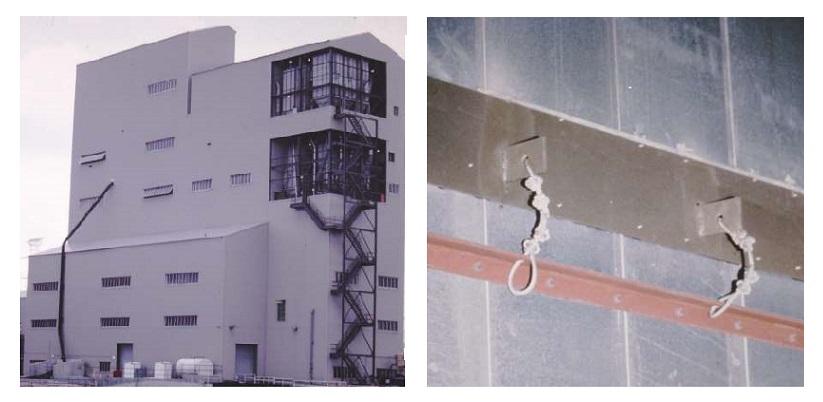
Damage Limiting Construction - Part 2 Building Overpressure Protection
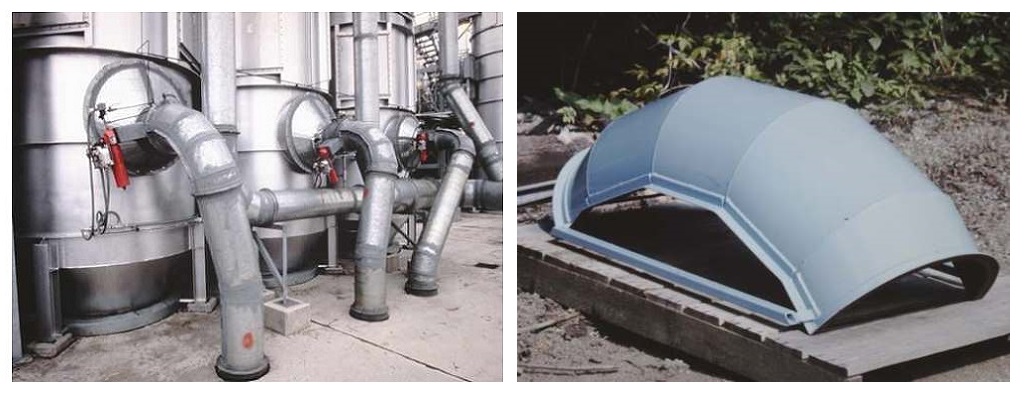
This article continues with the topic of damage limiting construction (DLC). If you missed Part 1, please go to my LinkedIn page to view. So the photos above show the finished project. On the left, is a view where the duct collectors at exposed to the outside and the building relief (aka, blow-off) panels which cannot be distinguished from normal stationary panels. Also one can see that an emergency escape system was installed. On the right is a shot of the blow-off panel from the inside.
The panels are installed in sections and tethered to building steel. The panel sections are connected to the building steel by way of shear bolts designed to break at a predetermined force. The number and capacity of the shear bolts relate back to the design building internal pressure that we are trying not to exceed. The next variable is how much area (SF) of relief panels do we need? This is where it gets tricky......
Damage Limiting Construction - Part 3 Deflagration Conduits
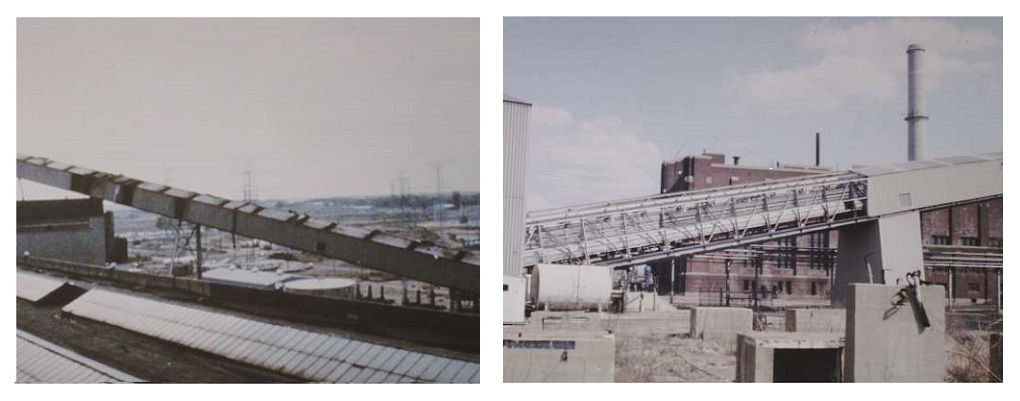
If you are just starting with this article on Damaging Limiting Construction, please go to my LinkedIn page and also read parts 1 and 2. This Part 3 will discuss how deflagrations (i.e., fire ball) can be transmitted from building to building via material handling conveyor structures, dust collector piping and similar type conduits. Conduits, in this context, are not electrical conduits containing wires, but are pathways.
The above photos depict the same conveyor system from 2 different angles. On the left, is the conveyor post-event. We know the fire ball made it to the main building (future article) but notice that most of the siding and roof panels appear intact. Also note that some roof panels that functioned as sky lights are blown away. They seem to act as pressure relief panels. When the fire ball made it to this conveyor, the pressure wave which preceded it shook the structure releasing latent coal dust that had settled on floors and beams and put it airborne. So the fire ball had its fuel to continue up the conveyor to the main building. The sky lights relieved just enough pressure so that the remaining side and roof panels remained intact. This was confirmed by a witness of the event that in their testimony said the propagation of the fire ball up the conveyor took several minutes and as the sky lights failed, there was a distinctive pop. And, when the fireball made it to the main building, "all hell broke loose"......
Damage Limiting Construction - Part 4 Deflagration Conduits (Dust Collectors)
If you are just starting with this article on Damaging Limiting Construction, please go to my LinkedIn page and also read Parts 1 and 2. This is a continuation of Part 3 topic that will discuss how deflagrations (i.e., fire ball) can be transmitted within a building or from building to building via dust collector conduits. Conduits, in this context, are not electrical conduits containing wires, but are pathways, like ductwork.
There are two technology camps when it comes to dust control. On one end of the spectrum you have the Suppressionists where the goal here is to suppress the dust before it becomes fugitive. That is, airborne. On the other end of the spectrum you have the Collectionists where the goal here is to collect and then manage the dust. And yes, there are plants that do both.
There have been many reported deflagration events that involved dust collectors. This article is not going to go into detail about active systems like fire suppression systems, fast acting fire valves, explosion protection systems and the like. We are going to discuss a passive device to minimize the risk of a fire ball propagating through the ductwork into other areas of the building. This device is called a Pressure Relief Elbow.......
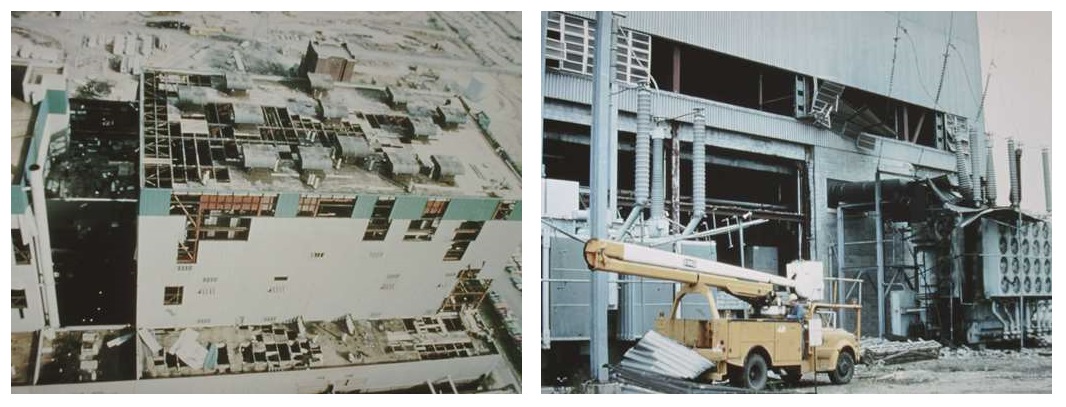
Damage Limiting Construction - Part 5 The Effects of Airborne Objects
If you are just starting with this article on Damaging Limiting Construction, please go to my LinkedIn page and also read Parts 1 through 4. This Part 5 topic will discuss the effects of airborne objects.
So if you are following this series, you now see from the photo on the left that the fire ball that started in a different building made its way to the main building via the material handling conveyor system. There are many things to point out here, but I want to focus on the roof panels for now. These were pre-cast concrete slabs that weigh-in about 4000 LBS each. They are roughly 4 FT by 10 FT. In order to lift this panel off its support clips, the uplifting pressure had to be at least 1 PSIG. So where did they go?
It was said that witness testimony stated that the event sounded like "All Hell Was Breaking Loose". Considering the mass of these panels and the vertical drop distance of approximately 100 FT, well it must have sounded like bombs going off, about 100 or so, laying a path of destruction as they fell to earth. So the suggestion here is to consider uplift as part of the roof slab support system. The second thing is to create sections of less-dense roof panel material as relief panels to control the overpressure event. Yes, this is damage limiting construction......
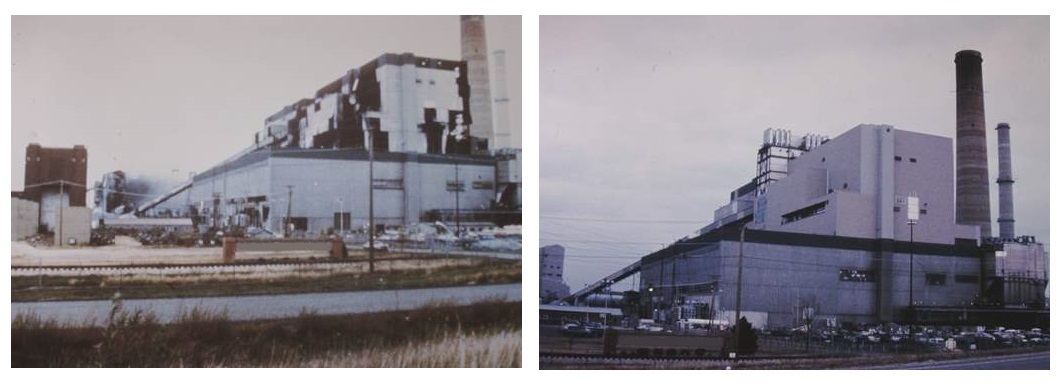
Damage Limiting Construction - Part 6 Conclusion
This segment concludes the series on damage limiting construction techniques as it relates to overpressure caused by a fire ball event (i.e., Deflagration). Although this series was focused on a coal dust deflagration, it is equally applicable for other combustible dusts, vapors and gas clouds.
Deflagration events occur more often than one might think. The more damaging ones like the corn mill explosion that occurred just last week in Wisconsin is one example. If you look at the photos on the Wisconsin event you will notice that the entire building appears to have been destroyed. Obviously, damage limiting construction was not installed for that structure.
I recall the quote "Those who cannot remember the past are condemned to repeat it" by George Santayana. This is why this series of articles is valid today as it was back then.
The photo on the left is how I saw the plant after the event. The photo on the right is how we left it after it was re-constructed. At that time the "Humpty Dumpty" team was focused on this plant but it was the start of a $50+ million dollar dust control project encompassing all that company's coal plants. We were later called the "Dust Busters"......
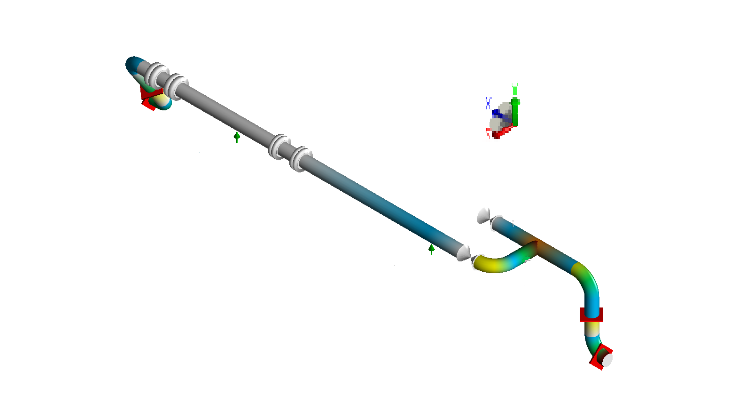
Pipeline Vibration Stress Cracking
This article will discuss the phenomenon of pipeline stress cracking due to vibration. This is also known as fatigue cracking. Fatigue cracking of steel is a fairly well documented issue and most of the ASME B31.X codes discuss this and methods to include stress allowances to mitigate the effects. It is also well documented in the design of bridges where the traffic load is the forcing function. (Ok. That was my structural engineer side of me talking.)
The methodology discussed herein is valid for piping whether it is an oil or gas pipeline or piping at a chemical or power plant. Unfortunately many piping systems are designed without accurate information on vibration or are not aware of how pump and compressors can induce vibration by the shear movement of gas or liquid. It is usually a "failure" that initiates the question "how did this happen". Here is the story.......