Inspection Manager
Inspection Manager (aka MI Manager) is an enterprise level risk based tool to manage plant infrastructure including maintenance, repairs, inspections, calibrations and chemical leaks (LDAR). Evaluated as "One of The Best Information Tools Available". Inspection Manager uses digital overlays on background photos or Google® Maps (for location) to display asset condition including city infrastructure, bridges, streets, underground and aboveground piping, tanks, vessels, instrumentation and plants systems. Inspection Manager is versatile and user friendly with user configurable dashboards, KPIs, risk based parameters, priorities, inspection tasks, inspection types and data libraries. Works with any browser. Direct data entry with cellular tablets and iPads. Configured for use with QR code tags. No ActiveX objects used. Locates and maps assets by GPS coordinates.
 Download Brochure
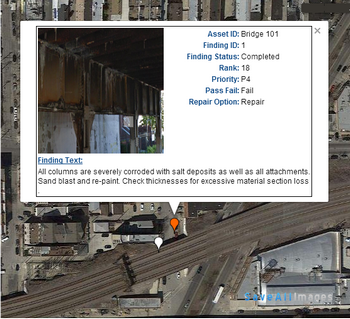
Bridge Application - Substructure (Google© Background)
Infrastructure inspection (photo below) data can be imported into MI Manager via field devices including GPS cocordinates, photos or video streams. Google® Maps displays this information as a digital overlays with color coded pins that launch the finding with a click of a mouse.
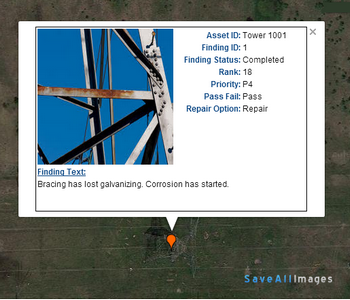
Transmision Tower Inspection (Google® Background)
Aerial inspection data from drones (photo below) can be imported into MI manager and displayed as a digital overlay. Color codes are user configurable for indicating high to low areas of material loss.
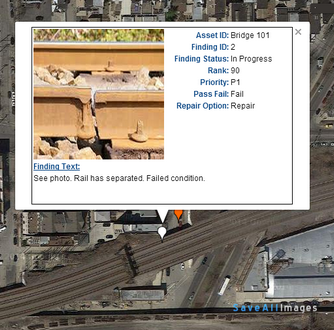
Railway Application - Rail Failure (Google® Background)
Railway inspections are an ideal application for cellular devices and MI Manager. Inspection data and photos are immediately uploaded to the servers and are available via color coded pins. Shown below is an example of a failed rail.
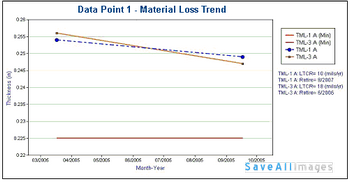
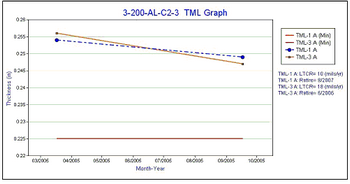
Material Loss Calculations
Material loss data can be trended and displayed graphically or as a parameter to the pin color code. Minimum thicknesses can assist in calculating component or asset end of life.
For Plant Integrity Programs
When used as a plant integrity application, Inspection Manager can track, assess and manage equipment condition and findings including material degradation, chemical leaks (LDAR) for
underground and aboveground piping, tanks, vessels, instrumentation and plants systems.
It is versatile with user configurable dashboards, KPIs, risk based parameters, priorities, inspection tasks, inspection types and data libraries.
Works with any browser. Direct data entry with cellular tablets and iPads. Configured for use with QR code tags. Locates and maps assets by GPS coordinates. Drone data feed capable.
Plant Integrity Programs Examples and Downloads
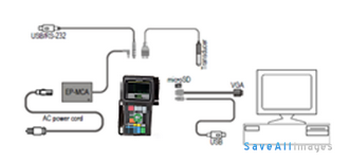
Field Data With Olympus® 38DL Data Logger®
When the field data is extensive as with thickness readings, phased array readings, etc., using a data logger device similar to the Olympus 38DL can assist in reducing data entry time. Field data is downloaded from the device to a Olympus to MI Manager interface driver that will upload the data directly to the database.
API 570 Piping (Photo Background)
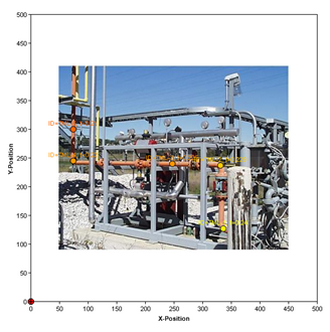
API 570 Piping
MI Manager displays piping condition using either a photo background or diagram. Thickness points can be created directly on the background image with a click of a mouse.
Data point IDs, thickness and MAWP are shown indicating areas of material loss. Color codes are user configurable for indicating high to low areas of material loss.
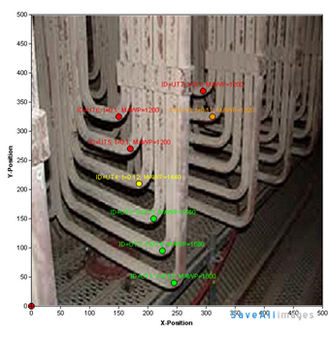
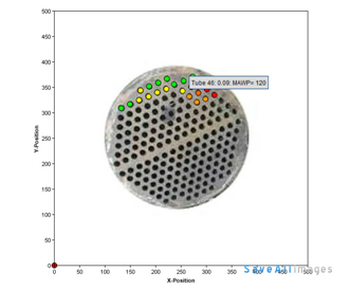
Boiler Tubes (Photo Background)
Data point IDs, thickness and MAWP are shown indicating areas of material loss. Color codes are user configurable for indicating high to low areas of material loss.
The condition view data points are active and when clicked present the data point material loss curve, MAWP Tmin and end of life calculations.
API 570 Calculations
MI Manager Provides MAWP and end of life calculation based on input parameters of tube diameter, yield stress, metal temperature and measured thickness. MAWP comparison with operating pressure assists in determining continued operating risk.
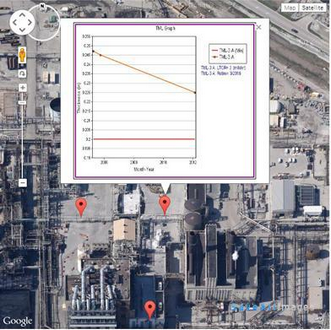
Petroleum Pipelines
For inspections covering large distances like pipelines, MI Manager can be used to set, track and display pipeline condition with active Google Maps. Tablet capable GPS positioning determines the inspection points which can be shown on a Google background.
Data and/or photos are entered with cellular tablets. Inspection information with picture or material loss chart (shown) are available when user clicks inspection point.
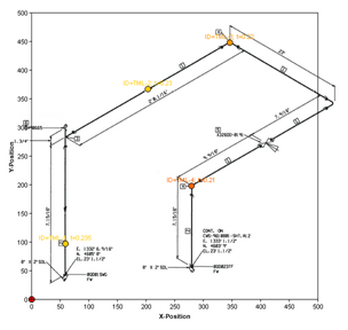
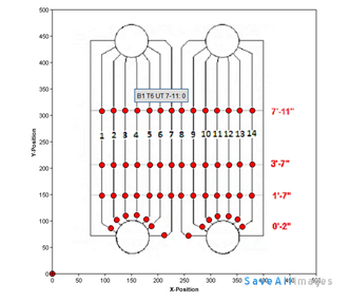
Boiler Tubes (Diagram Background)
Boiler diagrams can be used as a background for data tracking.
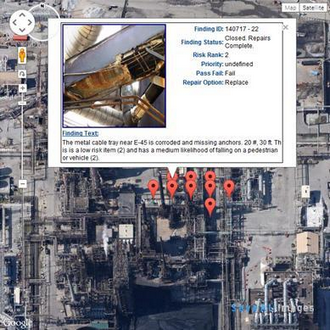
Plant Inspections
For exterior plant inspections, MI Manager can be used to set, track and display findings with active Google Maps. Tablet capable GPS positioning determines the inspection point coordidnates.
Findings and/or photos are entered with cellular tablets. Finding information is available when user clicks inspection point.
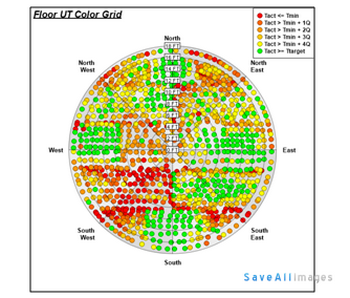
API 650/653 Storage Tanks
MI Manager displays API 650/653 storage tanks either as a photo background, generated background or diagram. Thickness points can be an auto-generated grid or discrete points created directly on the background image with a click of a mouse. Tank components include shell, floor, roof and nozzles. Tank floor shown.
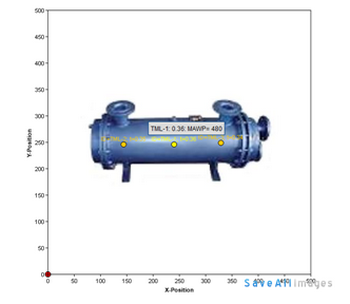
Heat Exchangers/Pressure Vessels
MI Manager displays heat exchanger condition using either a photo background or diagram. Heat exchanger components include shell, tube sheet, nozzles and channels.
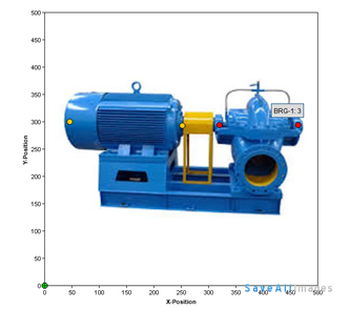
API/ASME Pumps
MI Manager displays pump condition with vibration trends and thickness readings. For either data type, the user can import a picture background or diagram. The data points can be created directly on the background image with a click of a mouse. Pump components include casing, bearings, nozzles and motor.
Heat Exchangers Tube Sheets
Heat exchanger tube sheet condition can be displayed using either a photo background or diagram.
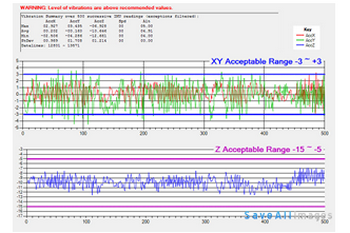
Pump Vibration Trends
Pump bearing vibration trends can be used to track pump condition. The pump bearing locations on the MI diagram are active and when clicked can launch the vibration trends obtained with a Fluke® Model 810 meter.
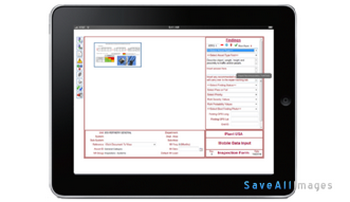
Data Gathering with IPads® and XPlore Bobcat®
Field data is easily entered with Tablets, iPads® or similar devices. These devices can be configured with a direct link to the MI Manager web software and data is directly uploaded to the server in real time. This includes photos, inspection data, measurements, etc. For intrinsically safe areas, the iPad will require an enclosure such as from See Forge®.
XPlore Technologies® has an integrated intrinsically safe case with a Windows OS Tablet. Bobcat model shown.

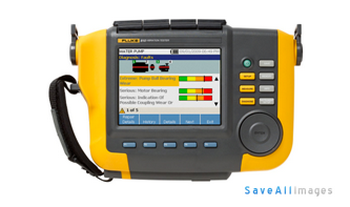
Pump Vibration Meter
Pump bearing vibration trends can be obtained with Fluke® Model 810 meter.